THE PRODUCTION FUNCTION OF HEALTH

The production of health presents a central concern to the health economist and to public policy. Consider that the role of health care in society, including medical care provided by physicians, is ultimately a production question. We must learn about the determinants of health and about the contribution of health care. We can then better understand what decisions, both personal and public, will best produce health. In medical terminology, this chapter addresses the efficacy and effectiveness of all those features of life, not only medical care, that plausibly contribute to our health. Unlike the typical doctor in practice, however, we look for evidence of the response of a “treatment” in the change in the health status of populations, as opposed to the treatment response of a medicine for the individual patient. We will see that the two approaches must remain in harmony and that both are fundamentally searches for causal relationships.

THE PRODUCTION FUNCTION OF HEALTH
A production function summarizes the relationship between inputs and outputs. The study of the production of health function requires that we inquire about the relationship between health inputs and health. The answers that economists and medical historians offer to this question surprise many people. First, the contribution of practitioner-provided health care to the historical downward trends in population mortality rates was probably negligible at least until well into the twentieth century. Second, while the total contribution of health care is substantial in the modern day, its marginal contribution in some cases is small.
This distinction between total and marginal contributions is crucial to understanding these issues. To illustrate this distinction, consider Figure 5-1A, which exhibits a theoretical health status production function for the population. Set aside the difficulties of measuring health status in populations, and assume that we have defined an adequate health status (HS) measure. Health status here is an increasing function of health care. Also, to avoid a perspective that is too narrowly focused on health care, we specify further that health status depends at least upon the population’s biological endowment, environment, and lifestyle.1 Thus, HS = HS (Health Care, Lifestyle, Environment, Human Biology). Improvements in any of these latter three factors will shift the curve upward. A production function describes the relationship of flows of inputs and flows of outputs over a specified time period, so the inputs and output in Figure 5-1A are measured over an implied period, such as a year. In practice, we might use the number of healthy days experienced by the population per capita, mortality rates, or disability days, to indicate health status.

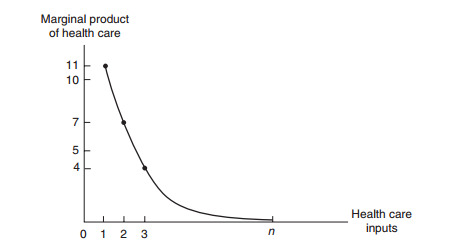
To simplify the depiction, we have reduced all health care inputs into one scale called Health Care. In reality, health care consists of many health care inputs. Some of them include medical care provided by doctors of medicine or osteopathy, but other health care professionals also provide care. Conceptually, the health care measure, HC, may be thought of as an aggregate of all these types of health care, the aggregation being based on dollar values. The marginal contribution of health care is its marginal product, meaning the increment to health caused by one extra unit of Health Care, holding all other inputs constant. Increasing Health Care from zero to one unit in Figure 5-1A improves health status by ΔHS1, the first unit’s marginal product. Numerically, this first unit of Health Care has increased the health status index from 32 to 43; ΔHS1 = 11 Health Status units. The next unit of medical care delivers a marginal product of ΔHS2 = 7, and so on. These marginal products are diminishing in size, illustrating the law of diminishing marginal returns. If society employs a total of n units of Health Care, then the total contribution of Health Care is the sum of the marginal products of each of the n units. This total contribution as shown, AB, may be substantial. However, the marginal product of the nth unit of medical care is ΔHSn, and it is small. In fact, we are nearly on the “flat of the curve.” Marginal product is graphed on Figure 5-1B. We have drawn the health production function as a rising curve that flattens out at higher levels of health care but never bends downward. Would the health production function eventually bend downward? Is it possible to get too much health care so that the health of the population is harmed? This is a logical possibility under at least two scenarios. Iatrogenic (meaning provider-caused) disease is an inevitable by-product of many medical interventions. For example, each surgery has its risks. Combinations of drugs may have unforeseen and adverse interactions. If the rate of iatrogenic disease does not fall while diminishing returns sets in, it is possible for the balance of help and harm from health care to be a net harm. Medical scientists, such as Cochrane (1972), have pressed the case that much medical care as often practiced has only weak scientific basis, making iatrogenesis a real probability. Writing for the public audience, Dubos (1960) and Illich (1976) once warned of a medical “nemesis” taking away our abilities to face the natural hardships of life by “medicalizing” these problems. Illich argued that this medicalization would lead to less personal effort to preserve health and less personal determination to persevere; the result becomes a decline in the health of the population and thus a negative marginal product for medical care.2 Return to the distinction between total product and marginal product. Often, the marginals, rather than the totals, are relevant to policy propositions. For example, no one seriously recommends that society eliminate all health care spending. However, it is reasonable to ask whether society would be better off if it could reduce health care expenditures by $1 billion and invest those funds in another productive use, such as housing, education,
transportation, defense, or other consumption. We could even reasonably ask if health itself could be improved by transferring the marginal $1 billion to environmental or lifestyle improvements. Many of our government programs encourage health care use in certain population groups, such as the poor and elderly. Other programs, such as tax preferences for health insurance, provide benefits for those who are neither poor nor elderly and encourage their consumption of health care. The theoretical issues raised here suggest that we question the wisdom of each of our programs. The theoretical questions can be investigated with data of several kinds either directly or indirectly relevant to the production of health issue. We begin with the historical role of medicine, which indirectly bears on the issue of health production. After providing an overview of these efforts, largely the work of medical and economic historians, we then turn to econometric studies of the modern-day production function.

Health Care Spending in Other Countries

Examining the health economies of other countries enhances our understanding of the U.S. health economy. Many countries have large health care sectors and face the same major issues. Table 1-1 shows how health care spending as a share of GDP grew rapidly in most countries between 1960 and 1980. A more mixed picture emerges after 1980. The health care share in the United States continued to grow in each period after 1980 shown in Table 1-1, but growth was more modest in most other countries. The data also indicate the relative size of the U.S. health economy compared to that of other countries. For example, health care’s share of GDP in the United States is nearly twice as large as the share in the United Kingdom—a country with national health insurance. Is care costlier in the United States? Is it higher quality care, or are we simply consuming more?


a 2009 or most recent year. OECD data for the United States may differ slightly from values reported by the Centers for Medicare and Medicaid Services. Source: Organization for Economic Cooperation and Development (OECD) Health Care Data, June 2011.

MEDICINE AND HEALTH CARE

THE HISTORICAL ROLE OF MEDICINE AND HEALTH CARE

Many medical historians agree that practitioner-provided medical interventions played only a small, perhaps negligible, role in the historical decline in population mortality rates. Effective medicine is a fairly recent phenomenon, and the delivery of effective medical interventions on a scale sufficient to affect population health indicators most likely appeared only well into the twentieth century. Though the magnitudes of other causes of mortality declines are still disputed, it is clear that a larger role, one of the most significant ones, might be attributed to public health measures and the spread of knowledge of the sources of disease. However, a number of scholars in this field attribute the largest share of the credit to improvements in environment, particularly to the greatly increased supply of foodstuffs that became available due to the agricultural and industrial revolutions.

The Rising Population and the Role of Medicine
The notion that medicine played a relatively minor historical role is certainly not new, and it has been asserted by researchers of various ideologies. This point of view is associated with the work of Thomas McKeown (1976), who focused on the dramatic rise in population in England and Wales from 1750 to the modern day. The pattern of world population growth, including population growth in England and Wales, has interested many scholars, including McKeown. World population is hard to estimate for the distant past, but research by the United Nations (1996) and others show that something extraordinary happened during the last 300 years. In the first century the population was roughly 300 million. For a thousand years thereafter, until the era of Viking ships, little or no change occurred. By the Age of Enlightenment, starting just before 1700, the population may have risen to 600 million. Then things began to change rapidly. Within a single century, the world population passed 1 billion people. The next 5 billion arrived within a mere 200 years. What had happened? Figure 5-2, based on United Nations data, reveals this startling pattern.
Returning to the history of England and Wales, the large rise in their populations in the period following 1750 is to a large degree a story of the population’s health. Population increase comes from increased birth rates, reduced mortality, or increased net in-migration. Migration was not an important source of population increase in England and Wales; when accurate birth rate and death rate data became available from 1841, these data alone proved able to account for the population change. Likewise, fertility probably did not account for the change because recorded birth rates have declined during the period since data have become available. Declines in birth rates are a common finding in countries undergoing industrialization and modernization. In contrast, recorded mortality rates did decline substantially. McKeown began by investigating which diseases contributed to the decline in death rates. Mortality data are very limited prior to the mid-1800s, but the records revealed an emerging picture. Table 5-1 shows death rates by disease category for three time periods. The table shows that airborne infectious diseases account for the largest single portion of mortality reduction, and waterborne infectious diseases also make up a substantial portion of known causes. Regarding the airborne diseases, other data suggest that the main airborne diseases showing a decline in mortality include tuberculosis, bronchitis, pneumonia, and influenza.

MEASURES OF HEALTH?

HOW DOES HEALTH CARE AFFECT OTHER MEASURES OF HEALTH?

Mortality rates are part of the story, but only a part, and for many, not even the most important part. Other measures include morbidity data, disability days, work loss days, and other indicators. Research available also measures the quality of life. The RAND Health Insurance Experiment (RHIE) is one of the largest randomly controlled economic experiments ever conducted. It was designed to test the effect of alternative health insurance policies on the demand for health care and on the health status of a large and closely observed group of people from all walks of life. RAND researchers discovered that the greater the portion of the health care bill that individuals are required to pay, the less health care they choose to purchase. While this should not have been surprising, what did surprise most health economists was how great the difference was; the fully insured purchased roughly 40 percent more health care than those who had to pay their own bills. This provides an opportunity to ask whether those with 40 percent more health care were also 40 percent more healthy. This was serendipitous from a research standpoint, but a perfectly valid way to test the real contribution of health care to people’s health within the context of a scientifically controlled experiment. Fortunately, RHIE analysts kept detailed records on each person, including a dozen or more measurements under each category of physical health, mental health, social health, and general health index. They also examined their subjects’ dental health, persistence of symptoms, health habits, and disability days. The results are easy to summarize. For dozens of items, virtually no differences were found between the groups studied; health care and health insurance did not seem to matter. A simple example from the RHIE illustrates the point. Table 5-4 provides detail on workloss days per employed person per year—a measure of health status and morbidity that some economic researchers like to use because it ties directly to both health and productivity. This table separates the RAND subjects into four groups, which differ by type of health insurance policy. Some subjects pay nothing out of pocket for their health care/health insurance package; some pay 25 percent to 50 percent of their bill themselves; others pay all of their health care bills up to a certain amount, called a deductible. The subject’s out-of-pocket cost ranges from zero (free) to about 95 percent of the bill. Newhouse et al. (1993) summarize: “Our results show that the 40 percent increase in services on the free-care plan had little or no effect on health status for the average adult.” The effects on children showed a somewhat similar pattern. Valdez et al. (1985) examined data for 1,844 children in the RAND study—children who differed primarily by the type of insurance plan their families obtained. Children under the cost-sharing plans consumed up to one-third less care. However, the reduction in care was not significantly related to health status measures. It may seem from the RAND results that public provision of health insurance to both adults and children might not be justifiable on the basis of benefits to health. However, as Jonathan Gruber (2008) points out, this conclusion does not follow. No one in the RAND Experiment was “uninsured,” completely without insurance, as are close to 50 million Americans as of this writing (the Patient Protection and Affordable Care Act begins to address them in 2014). The least insured individuals studied by RAND had full coverage for health expenditures above a deductible, which was $1,000. Studies of the truly uninsured began to appear showing significant health gains from the provision of public insurance (Currie and Gruber, 1996; Doyle, 2005; Hanratty, 1996). These studies report reductions in infant and neonate deaths of around 5 to 10 percent. The Institute of Medicine estimates suggest that even larger gains are possible; they claim that the uninsured face a 25 percent greater mortality risks. Gruber further explains why these studies do not conflict with RAND. He proposes that the marginal effectiveness of medical expenditures is quite high for the first expenditures but then drops off precipitously, a plausible pattern given diminishing marginal returns. Eventually, additional spending does no good and the effectiveness curve flattens out . . . This appears to be the case as we move from less to more generous coverage, as in the RAND Health Insurances Experiment (Gruber, 2008: 584).


Schooling in Health

Empirical Studies on the Role of Schooling in Health

Recent evidence supports the view that education makes one a more efficient producer of health (Lleras-Muney, 2005). Knowing that compulsory education laws came into being in various places at various times in the twentieth century, she reasoned that the related birth cohorts from that era would
have experienced different levels of education but would have been similar in many other respects. This formed a natural experiment in which she could analyze the survival patterns of these people to detect a pure influence of education on health. Furthermore, the education laws could not have been directly manipulated by the study subjects, so they were good “instruments” for education. By this approach, she was able to conclude that education has a clear, causal, and positive effect on health. By 1960, the early century education experience appeared to have increased life years by 1.7 years, a substantial increase and one not due to time preferences of the subjects. Lleras-Muney’s study inspired new research of the effects of new laws extending the length of compulsory education in England and Ireland (Oreopoulus, 2006; Auld and Sidhu, 2005). These supported the earlier findings; an additional year of schooling caused an improvement in the affected student’s health. To emphasize, the improved health was experienced by “likely dropouts,” forced by the law to attend one more year of high school. Interestingly, Lindeboom and colleagues (2006) inquired through research as to whether the children born later on to these students also benefited from improved health, but the findings indicated that they did not. In summary, research has supported the theory that education makes people more
efficient producers of their own health. Cutler and Lleras-Muney (2006) add further support in their recent work by showing that education is associated statistically with better reasoned choices of health related behaviors. One finds as well that education plays a stronger role in health for cases where new medical knowledge is more important.

CONCLUSIONS
In this chapter, we investigated many topics related both directly and indirectly to the production of health. The health production function exhibits the law of diminishing marginal returns. While the total contribution of health care is substantial, the marginal product is often small. Historically, we found that much of the decline in mortality rates occurred prior to the introduction of specific,
effective medical interventions. Thus, historically the contributions of health care, at least as provided by the health practitioner, were probably small until well into the twentieth century. The small, modern-day marginal product of health care is statistically significant. Health care benefits people differentially and is generally more productive on the margin for women and blacks. Similarly, certain categories of health care have greater marginal effects on the population than others; prenatal care programs are examples of the more productive categories. Education has a strong association with health status. Whether this means that it causally improves health has long been an issue of contention. Recent research supports the view that education improves health.

HEALTH INSURANCE

HEALTH INSURANCE AND THE EFFICIENT ALLOCATION OF RESOURCES
This section examines the impact of health insurance on health care demand. Economists commonly examine the efficient allocation of resources, which occurs when the incremental cost of bringing the resources to market (marginal cost) equals the valuation in the market to those who buy the resources (marginal benefit). If the marginal benefit is greater (less) than the marginal cost, one could improve society’s welfare by allocating more (fewer) resources to the sector or individual, and less (more) resources to other sectors. Consider Figure 8-5, which shows the marginal cost of care at P0 and the demand for care by a consumer under alternative conditions of insurance. If this consumer is not insured, then the optimal choice of health care is Q0 units. The price (including travel time, parking, and the cost of bringing the service to market) reflects the cost to society of bringing the entire package to the market. Based on the consumer’s (and the physician’s) preferences, the marginal benefit, as described through the demand curve, equals the marginal cost. In economic terminology, this is an efficient allocation.


Insurance for Heart Attacks

Insurance for Heart Attacks and Hangnails

In comparing types of losses, for any probability of illness, the larger the expected loss, the larger the
gain from the insurance. We see this in Figure 11-1A by comparing the distances between the expected utility line and the utility curve for a small loss (line segment EA) and for a large loss (line segment BA). Segment EA shows a small distance; segment BA, a larger one. Hence, if Sara has equal probabilities of a hangnail (small loss) and a heart attack (large loss), the expected gain to her from insurance for heart attack coverage will exceed the gain for hangnail coverage. Consider now the insurers’ decisions in providing insurance. If the event is almost certain, the insurers’ costs of administering the policy may exceed the benefits to the consumers. In Figure 11-1B from B to C, it will not pay to insure claims because for the firms to earn profits they must charge marginal costs, which here exceed the expected consumers’ marginal benefits. Between points C and D expected marginal benefits exceed marginal costs. To the right of point D, again the marginal costs exceed the expected marginal benefits, and no insurance will be provided. As the diagram is drawn, no firm could afford to offer hangnail coverage.


Loading Costs and the Uninsured


Loading Costs and the Uninsured

The analysis of loading costs provides one avenue for addressing the problem of those who cannot get
insurance. Health insurance in the United States has been largely available through participation in the
labor market. Those who do not participate in the labor market, and many of those who are employed
by small businesses, self-employed, or sporadically employed have found it difficult to get insurance.
Many explanations have been proposed, but it is apparent that the per-person costs of processing
information and claims of those individuals who are outside larger organizations (either companies
or unions) are higher. This results in an increase in the firms’ marginal costs relative to the
consumer’s marginal benefits and can reduce or eliminate the range of services that may be offered.
The analysis also helps address the impacts of entry and exit in the insurance market. More
efficient processing and information handling presumably will lower the premiums that must be paid by
customers in the market. If we look again at Figure 11-1B, we recognize that improved information handling
and processing would not only lead to lower marginal costs and hence lower prices, but also would
permit firms to offer services (based on probability of occurrence) that had not previously been offered.
Consider points C or D, where the expected marginal benefit was previously just equal to (or
possibly just below) the marginal cost. An insurer who lowers costs can offer coverage for types of
events that previously were uncovered. Conversely, increased costs, due either to market forces or to
mandated coverage, would force firms to cut back coverage on events for which they could not (due
to limited consumer surplus) pass along the increased costs on to the customers.


Insurance and Substitutability

Insurance and Substitutability
Assume now that like most Americans the patient has insurance coverage. Begin with a policy that covers a constant proportion (e.g., 80 percent) of spending on either D or M. Out-of-pocket patient costs are $10 for each prescription (20 percent of $50) and $20 for a medical visit (20 percent of $100). Because the slope of the patient’s budget line does not change, the optimal choice remains at point E, and the patient continues to buy four units of drugs and six visits. Total drug costs will continue to be minimized with the patient paying 20 percent ($160) and the insurer paying 80 percent ($640) of the $800 total bill. However, D and M often are not treated uniformly under traditional health insurance. Consider a policy that pays 80 percent of medical costs but requires a deductible of only $5 (copayment) for each prescription. The patient’s drug price is the $5 deductible regardless of the actual price of the medication. If the patient’s out-of-pocket drug costs diminish, the numerical slope of the cost-minimizing budget line diminishes (in our example, it is now -5/20 = 0.25). The patient will have an incentive to substitute D for M at E–. Continuing with the example, let D2 increase from 4 to 5, and M2 fall from 6 to 5.75. The patient’s cost burden diminishes from $160 to $140 or: However, the total cost of care (patient plus insurer) increases from $800 to $825. We know this is true because we already determined that E is the least costly combination to provide HS1. Similarly, if prescription prices (to the insurer) increase, say to $100, the patient still pays $5 and will remain at E– with the insurer picking up the increased drug costs. Patients have no incentive to economize by making substitutions and moving toward E. The higher the prescription price, the greater is the distortion. A similar distortion toward excessive levels of M and greater total costs occurs when the patient’s coverage excludes or limits drug benefits. Here, the savings from reducing M will more than offset the additional drug spending from improved drug coverage.


Technological Change
At the turn of this twenty-first century, a new category of experimental drugs, blood vessel inhibitors,
generated extraordinary excitement in the medical community by fighting both cancer and
heart disease. Technology often is associated with major breakthroughs. More often, however, new
drugs are similar to existing drugs, but they may produce somewhat better outcomes (if only for
some patients) or reduced side effects.
With technological improvements, fewer inputs are needed to produce a given health outcome,
or outcomes that were previously unattainable are now attainable. For example, begin with
HS1 in Figure 17-3 and let HS1
* represent all combinations of inputs with a new drug that leads to the same health status as HS1. If the cost-minimizing ratio of inputs at a given price ratio remains
unchanged, so that it lies along the ray 0E (denoted (M/D)0), the innovation represents a neutral
technological change. As drawn, the new drug saves a relatively high amount of the medical input at
any given price ratio. That is, drug utilization increases relative to medical care as the patient moves
to E* and substitutes D for M. As noted in the figure, the lower ratio of M to D is reflected in the less
steeply sloped ray, (M/D)1.


New technology can increase costs for two reasons. First, it can routinely provide health levels
that were unattainable previously (e.g., HS2
* at point E**). It may require much more drug use and
possibly increased use of M, as well. When health improvements are dramatic or when drugs treat
serious conditions that were not treatable previously, cost concerns are likely to be far less troublesome
than those leading to only marginal improvements in health.
The second cost pressure comes from insurance. As we have seen, a patient with a constant
copayment will not face any price increases of the new drug. Assume that the slope of the budget
line in Figure 17-3 reflects the patient’s copayment of $5 and the patient moves from E to E*
. If the
price of the new drug is high enough, the total cost of care at E* could be substantially higher than
total costs at the original equilibrium at E.
For conventional goods, where the consumer pays the entire price out of pocket, such technological
changes will not be introduced because they will not be demanded. With insurance, the
determination and elimination of cost-inefficient technology are far more difficult. A drug-maker
may market a socially cost-inefficient drug successfully simply beca

Importance of Labor and Capital in the Health Economy

Importance of Labor and Capital in the Health Economy

The flip side of spending is reflected through the jobs that have been created in the health economy. As shown in Table 1-3A, 15.5 million people—11.1 percent of all employed civilians—worked at various health services sites in 2009. These numbers continued to grow despite the loss of over 5 million jobs in the U.S economy between 2007 and 2009. Hospitals dominate, employing 40.5 percent of health care workers. Other major employers include offices and clinics of physicians (10 percent), nursing care facilities (12.1 percent), and offices and clinics of dentists (5.2 percent). Table 1-3B provides information on specific health care occupations and their growth since 1970. In 2009, there were over 972,000 physicians and almost 268,000 pharmacists. The nursing sector alone consisted of over 3 million people with over three-quarters of them trained as registered nurses. The considerable growth in health care personnel is evident. In 1970, there were 334,000 physicians, or 164 physicians per 100,000 people. By 2009, the number of physicians had increased by 191 percent to 972,000 or 317 per 100,000 population. The number of registered nurses had more than tripled by 2009, with their number per 100,000 population more than doubling from 369 to 842. Reflecting the increases in spending, the health care sector serves increasingly as a source of employment. Thus, cutbacks in spending on health care, if proposed and implemented, would typically mean cutbacks in employment opportunities. In addition to labor, a substantial amount of capital has been drawn to the U.S. health care system. The number of nursing home beds increased from about 1.3 million in 1976 to about 1.7 million in 2009 (beds per capita, however, decreased slightly). The number of short-term


hospital beds (as distinguished from nursing homes) peaked in the late 1970s, at almost 1.5 million, but the total number has since leveled at approximately 950,000. There are also considerable and growing amounts of other capital—such as diagnostic equipment—per bed.

Economic Problems of Health Care Delivery

The Importance Attached to Economic Problems of Health Care Delivery

The health sector receives attention from policymakers because of its widely perceived problems. The substantial resources devoted to health care are reflected in a more meaningful way through the average level of this nation’s spending for health care. Table 1-4 provides various measures of health care spending and its growth since 1960. Table 1-4 shows how national health expenditures (NHE) grew from $27 billion in 1960 to $2,486 billion in 2009. During that period, the U.S. population grew by 65 percent from 186 million to 307 million. Thus, NHE per capita rose by a multiple of 55, from $147 in 1960 to $8,086 in 2009. However, the real increase is what matters most. Prices, as measured by the broad-based consumer price index (CPI), rose 625 percent over the same period. After deflating by the CPI, we find that real expenditures per capita in 2009 were 7.6 times the 1960 level—still a hefty increase.1

Inflation 
Although we have deflated the spending values using the CPI, medical care prices have grown faster historically than prices overall. Table 1-4 also shows the pattern of health care inflation since 1960. Note that hospital and physician care prices have risen much faster than the CPI—a phenomenon that is typical of other health care services and commodities as well. In 2009, the medical care price index (not shown in Table 1-4) rose by 3.2 percent even as the U.S. economy experienced deflation. Medical price inflation is a common problem for maintaining health programs, and it has spurred numerous cost-containment efforts by the government. Understanding and evaluating the effects of such measures are important tasks for the health economist

Access
For many, the rising costs significantly reduce accessibility to health care. Financial affordability influences demand for most goods and services, and there are many reasons why some people do not have health insurance. What is clear is that the number of uninsured has risen and that in 2009 and 2010 approximately 50 million people in the United States lacked insurance. Many more are considered to have inadequate insurance. The problems of cost, inflation, and uninsured people have led to numerous proposals for some form of national health insurance. Later in this book, we will examine several broad groups of plans, the national health insurance programs that exist in other countries, and the newly established Patient Protection and Affordable Care Act, passed in 2010.


Quality 
Increases in the quality of care contribute to spending increases. Often, the focus is on ensuring quality through professional licensure and certification and, especially for hospitals, through quality-assurance programs. At the same time, concerns arise about access to high-quality care, and they are not limited to those without insurance or with minimal insurance. Other observers, however, express concerns that the quality of care in the United States is often excessive, especially for some “high-tech” treatments. For such treatments, the costs of resources may exceed the benefits to patients. The interplay among insurance, technology, and consumption is of major interest to economists.